By Hitesh Mittal, Founder & CEO; Nigam Saraiya, Head of Product; and Kathryn Berkow, Senior Researcher at BestEx Research
INTRODUCTION
In this paper, we study the impact of the ongoing COVID-19 crisis on US equity market liquidity. We compare spread costs, market impact costs, intraday market conditions, and market resilience during the crisis and under normal market conditions. We hope this will help institutional investors and other market participants navigate these challenging conditions more easily. “Liquidity” refers to the difficulty of buying or selling an asset, but investors often confuse liquidity with “volume” (a decent proxy) but there are other factors at play such as volatility, leverage available to liquidity providers, and market resiliency. For smaller trades the cost of liquidity is the bid-offer spread, which an investor can pay to execute up to the shares available at the NBBO (referred to as “NBBO depth” here). Since both spreads and depth are affected in a crisis period, we study the normalized bid-offer spread, comparing the estimated spread for fixed depth before and after the COVID-19 crisis began. For orders larger than the NBBO depth, institutional investors realize market impact costs in addition to the bid-offer spread. We study the market impact costs for varying
order sizes and participation rates. We also report on changing intraday liquidity dynamics to help investors optimize execution throughout the day.
EXECUTIVE SUMMARY
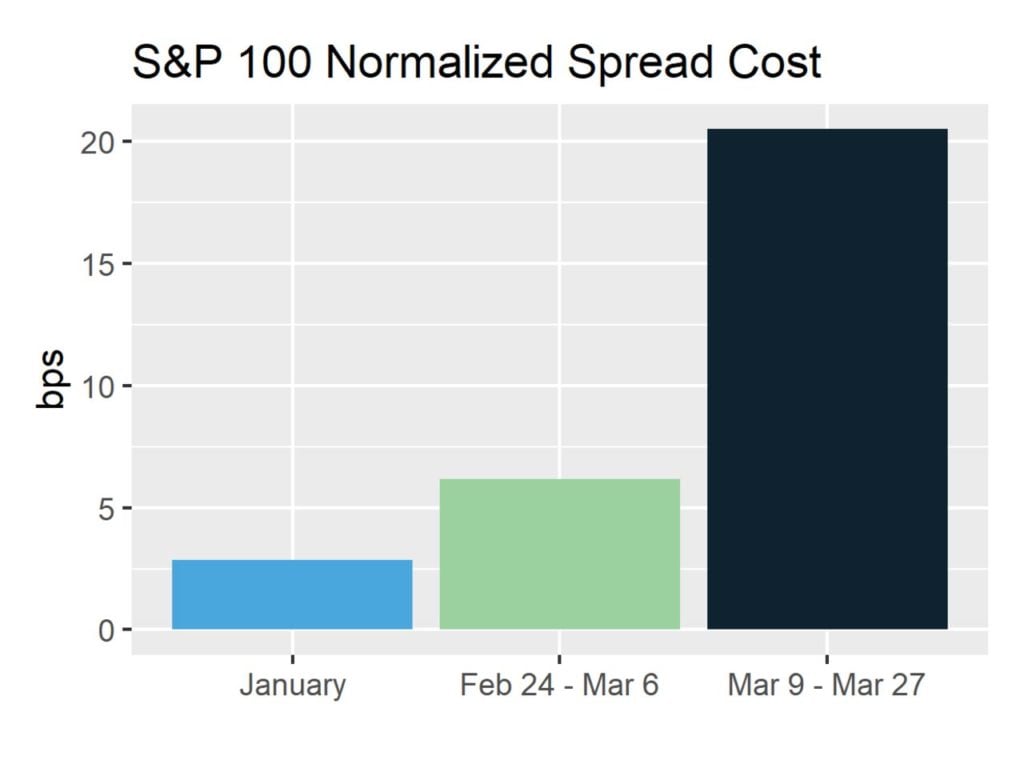
1. Spreads have increased significantly and NBBO depth has declined. Normalized spread costs are up 7.2 times for S&P 100 stocks, 4.1 times for Russell 2000 stocks. For a fixed, typically available amount of liquidity in
normal trading conditions, the average cost during the COVID-19 crisis period for S&P 100 stocks is 20.5 basis points, compared to the usual 2.9bps.

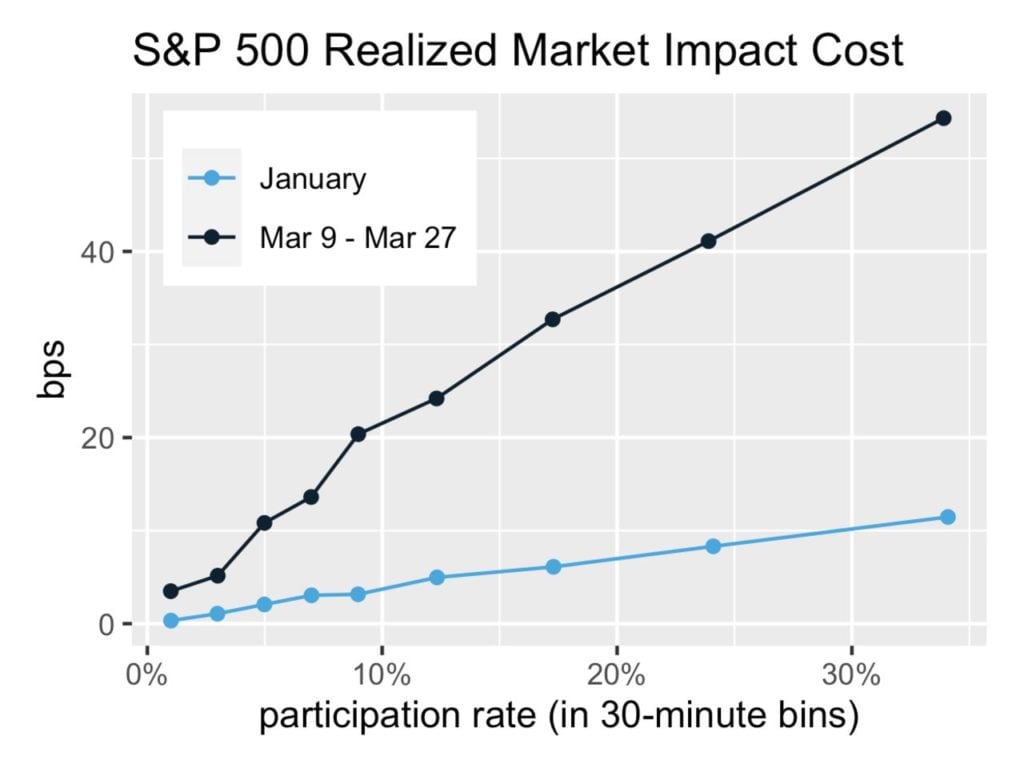
2. Investors should pay special attention to their speed of execution and order size relative to average daily volume. Realized market impact costs have increased significantly. The realized market impact of trading 2% of volume today is equivalent to trading at 10% of the volume in normal conditions for S&P 100 stocks. These costs come in addition to the higher bid-offer spread costs. Systematic asset managers should review pre-trade cost estimation models used during portfolio construction, and all asset managers should review rule-based order size limits that are typically specified as a percent of average daily volume.

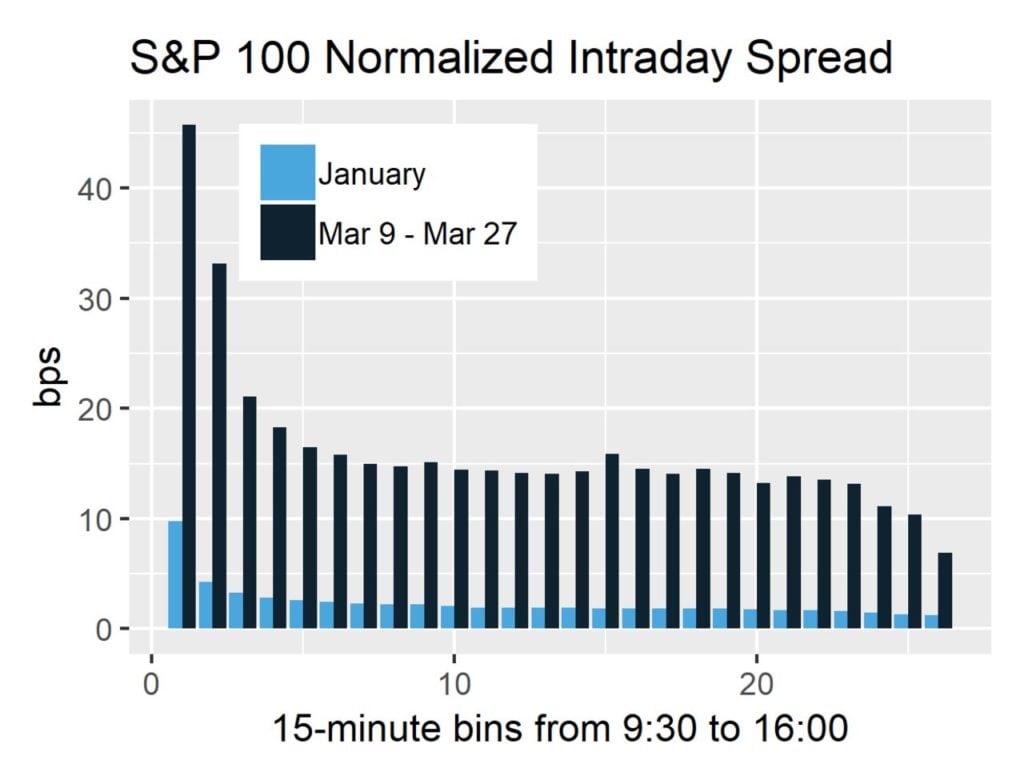
3. Investors should pay special attention to the first thirty minutes of the day. While the first thirty minutes have always been relatively costly to traders, the cost of execution before 10:00am has gone up significantly. For S&P 100 stocks, spreads have increased from 6.8bps to 29.3bps in the first thirty minutes, and for Russell 2000 constituents, spreads have increased from 106.5bps to 378.4bps, on average.

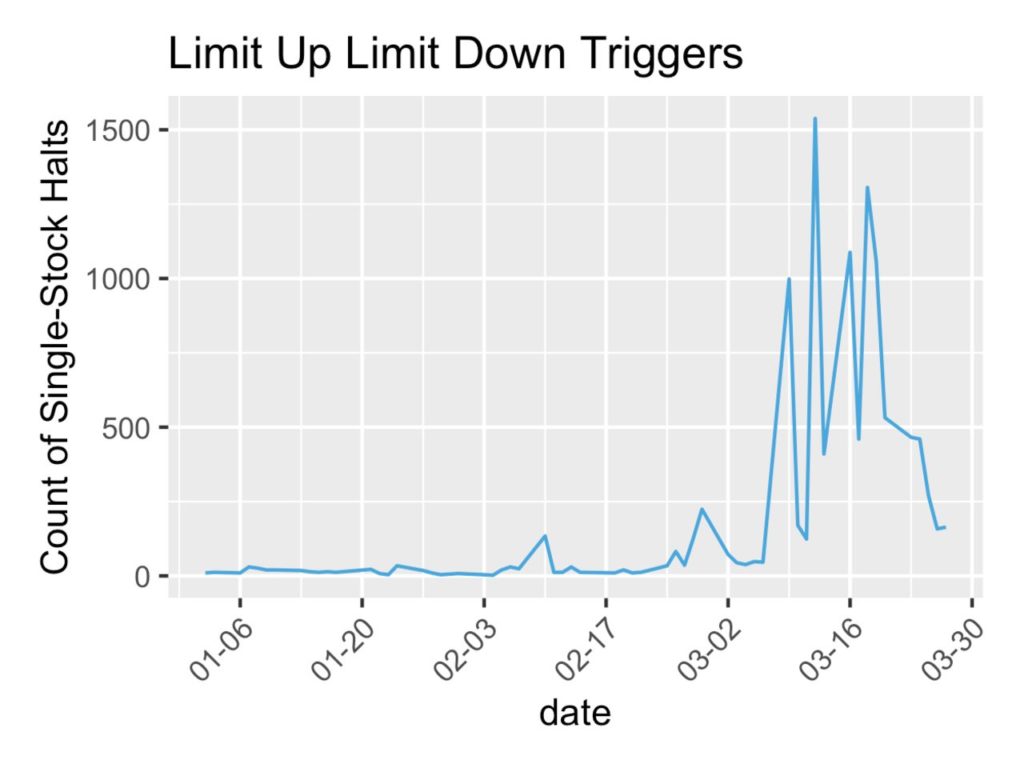
4. The number of times the Limit Up Limit Down mechanism has paused trading in stocks has gone up exponentially. Institutional traders should pay attention to the rules related to LULD and ensure that the execution algorithms handle LULDs well and do not exacerbate poor conditions during the limited execution horizon remaining after stocks trigger these limits.

Click here for the full report.


