Beware of the Shallows: A Deep Dive into Public Dark Pool Trading in Australia
By Eugene Budovsky, Director, Head of Low-touch Execution, Australia, Credit Suisse
The dominance of completely public dark pools in the Australian equities market is a unique market structure feature in global equities. This article is a deep dive into the nuances of this unique setup, as well as a guide to some important tools available to avoid the common pitfalls.

Every market specialist has delusions of grandeur that their market is “unique”. I am no exception, however I believe there is at least some empirical evidence to back up the claim. The uniqueness of the Australian equities market comes from the dominance of fully public dark pools in Australia, and how those dark pools interact with lit market trading. Although Australian market structure has been relatively stable for a number of years, I still find that many traders miss important nuances that can have an outsized impact on their trading. If you live and breathe Australian equities trading, there will not be much new for you here. If however trading is only part of your role, or if Australia is one of multiple markets you trade, then please read on. Hopefully you will finish the article with an important new tool in your trading kit. Grab your towel and let’s go for a swim.
PUBLIC DARK POOL DOMINANCE
Australia has two exchange-integrated public dark pools: ASX Centre Point and Chi-X Hidden Liquidity. Together, they account for around 12% of continuous on-market trading in Australia. The dark share in some stocks/sectors is significantly higher, with REITs in particular often having 30%+ on-market trading occur in the dark.
FIGURE 1
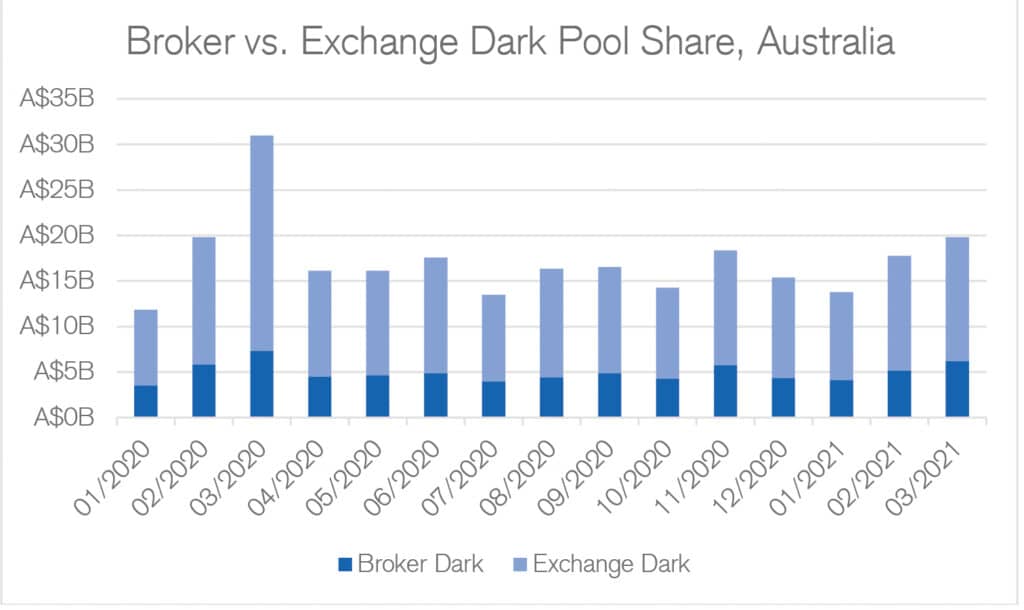
On the flip side, broker dark pools have continued to lose share in Australia (FIGURE 1 shows their relatively small contribution to overall notional). In 2013, ASIC implemented a “meaningful price improvement” rule as part of its Market Integrity Rules. The new rule in effect meant that all non-lit trading below a certain value threshold needed to occur either at National Best Bid and Offer (NBBO) mid, or at least one whole tick price improvement to the NBBO. There are some nuances and caveats, however in practice almost all dark pool trading has moved to NBBO mid. One of the primary value propositions of broker dark pools historically has been the ability to cross liquidity at touch, and when this ability was taken away due to the rule change, there was a very fast migration away from broker pools to the two public dark pools. In fact, fifteen crossing systems have ceased operation in Australia in the last decade.
INTEGRATED ORDER TYPES
The key to the uniqueness of Australia’s Dark Pool landscape is the deep integration of exchange dark pools into the continuous order book. Both equity exchanges in Australia have integrated order types that access lit and dark liquidity with a combined order.
For ASX, the relevant order type is ASX Sweep, which sweeps through ASX Centre Point and then takes liquidity from the lit market. In the past year, a monthly average of 58% of all aggressive ASX orders were sent using the Sweep order type (source: ASX, April 2021).
For Chi-X, the dark pool (Hidden Liquidity) is fully integrated with the lit market. This means that 100% of aggressive lit orders on Chi-X will sweep through the Chi-X dark pool.
The net effect here is that if you have resting dark pool orders in both public dark pools in Australia with no limits/filters set, you will interact with almost 60% of aggressive orders on the primary exchange, and 100% of aggressive orders on the secondary exchange. You can think of the integrated order types as essentially a trip wire for information. You want to jump into the deeper end of the pool, with your shorts still on.
“HOW DID I HAVE SO MUCH IMPACT? ISN’T MY ORDER SUPPOSED TO BE DARK?”
I have fielded some version of that question many times. There is a certain expectation that trading in a dark pool minimises your price impact on a stock. In certain situations in Australia, the opposite can be true. The answer has nothing to do with any grand conspiracies. Part of the answer relates to signaling. However, the primary reason a dark order can have a large amount of impact in Australia is simple supply-demand mechanics.
Remember that when you are resting in both public dark pools in Australia, you are interacting with 60% of aggressive ASX orders and 100% of aggressive Chi-X orders. If you are buying, it means that you are buying the majority of the stock going through with little opportunity for the stock price to “breathe”. Passive buyers on the bid are not able to get set despite volume going through the market. This means that they need to cross the spread to keep up with volume, and the price moves higher. Occam’s Razor is the best guide here - if you have been buying at 50%+ of the volume then most likely the explanation for a price move up is also the simplest: there is more buying than selling.
MINIMUM EXECUTABLE QUANTITY (MEQ): THE LIFEGUARD OF DARK POOL TRADING
The primary tool that traders have to limit the impact of their dark orders (apart from using limit prices), is the venerable FIX tag 110, Minimum Executable Quantity (MEQ). For the uninitiated, MEQ allows you to set a share limit on a dark order below which you will not get a fill. For example, if you have a resting dark order to buy 100,000 shares with a 10,000 share MEQ, and a seller places a dark order to sell 5 shares, the two orders will simply not match. MEQ effectively sets a matching criteria on your order that is on par with a price limit. At the risk of belabouring the swimming pool analogy, it can act as a lifeguard and stop you from diving head-first into the shallow end.
Setting an MEQ can have a very pronounced effect on your fill rate, and on the amount of signaling that you give out to the market. To analyse how various MEQ settings impact on trading, we have looked at how fill values and trade counts are affected as MEQ setting is increased. To normalise across the whole market, we look at setting MEQ as a ratio of the average lit-market trade size (ATS) in each individual security. For example, if the average trade size in a stock is 1000, an MEQ of 20% of ATS would equate to a setting of 200 shares.
FIGURE 2
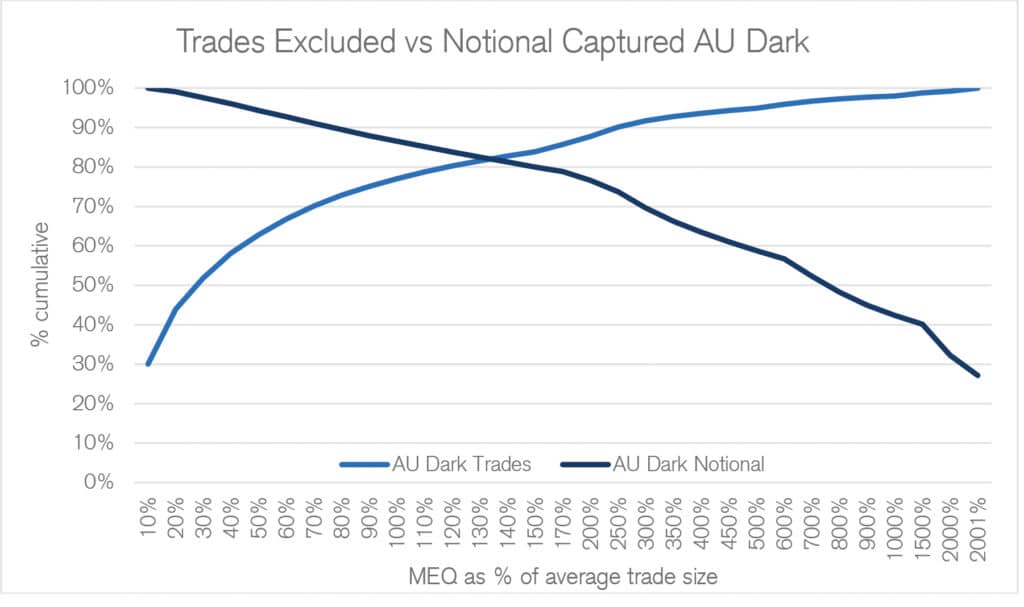
FIGURE 2 shows how fill rates and trade counts are affected by increasing MEQ sizes. The light blue line is the percentage of dark trades excluded by various MEQ settings (this increases as the MEQ setting increases). The dark blue line shows the percentage of dark traded notional captured. Simplistically, the objective is to maximize the value captured, while minimising the number of trades (and associated signaling). The intersection of the two lines is just a data artefact, however it is as good a point as any to illustrate the trade-off available to traders by setting MEQ at an intelligent level. An MEQ setting of ~130% of average trade size excludes ~80% of trades by count, however it still captures 80% of notional value traded. That is, you are trading 5x less often than if you had no MEQ set, however you are still capturing 80% of the dark notional that is traded.
As a general observation, the percentage of trades avoided increases quite sharply as you increase MEQ (a setting of 100% ATS excludes around ~76% of trades by count), whereas the notional value captured declines relatively slowly as MEQ increases (a setting of 100% ATS captures around 86% of traded value, a setting of 700% ATS still captures around 50% of traded value). The exact reason for this is hard to pin down definitively, however my experience leads to two fairly simple explanations. Institutional broker algos and market makers tend to slice orders up fairly finely (both when resting passively and when crossing the spread), however these orders tend to be a relatively small portion of the overall dark turnover. The larger portion of dark turnover is accounted for by traders either using dedicated dark algos, sending manual submissions, or using “Dark Would” style functionality. In any of these cases, the order sizes tend to be disproportionately large.
I have included two additional charts (FIGURE 3 & FIGURE 4) that show some interesting patterns:
FIGURE 3
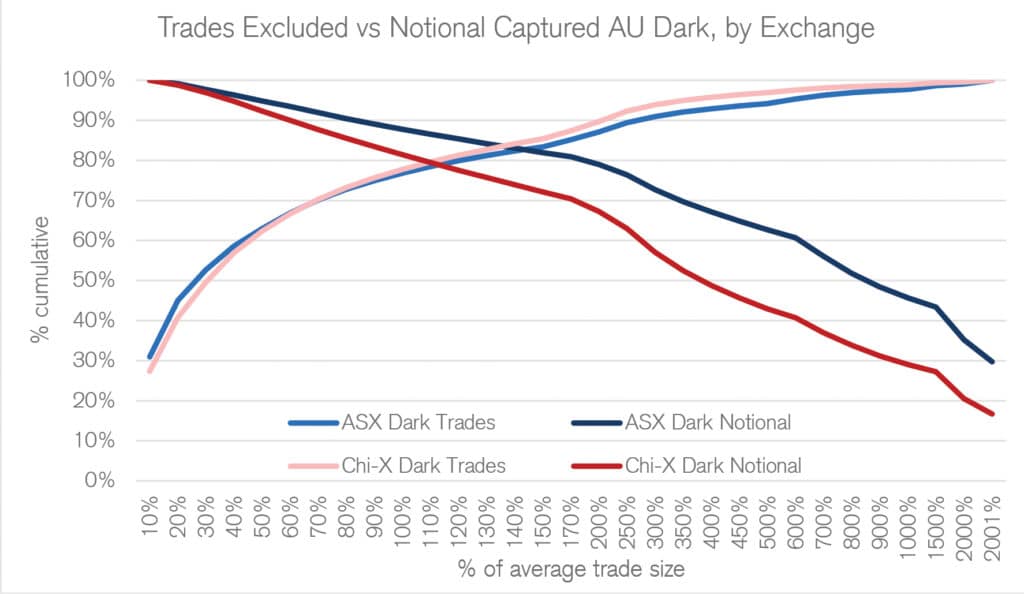
The number of trades excluded rises in a similar pattern across both exchanges as MEQ increases, however there is a steeper decline in the notional value captured on Chi-X as compared to ASX. My gut feel is that this is due to a higher portion of passive dark trading on Chi-X being a result of institutional broker algos and market makers, which have a lower average trade size.
FIGURE 4
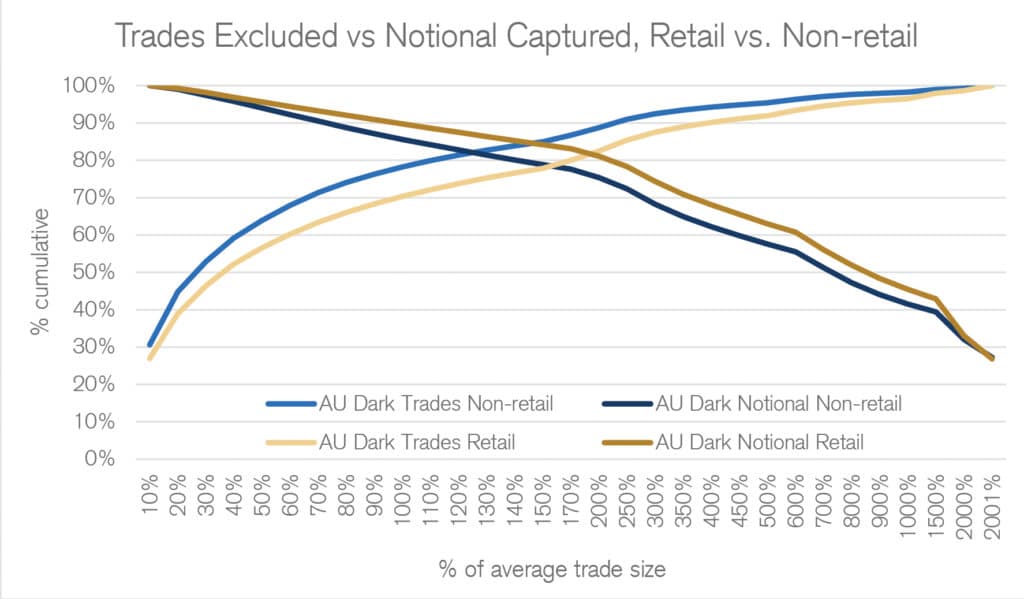
The pattern is less obvious in this chart, however I thought it was interesting to note that non-retail value traded declines more sharply than retail, implying that retail brokers have a significantly higher average trade size in the dark. This lines up with the earlier observation that a large portion of small dark trades is due to a combination of institutional algos and market markers, and also shows that the use of this parameter allows for an element of counterparty selection.
As a final point, you can see from the data (FIGURE 5) that this normalisation using average trade size is important not just from the point of analysis, but also from the angle of using this parameter as a trading tool. For example, if you are setting MEQ in shares, a setting of 100 shares would mean you only capture 31% of the traded value in COH and exclude 98% of trades by count. This same setting would capture almost all of the dark traded value in TLS (98%). By comparison if you were to set an MEQ of 100% of average trade size (equating to 7 shares in COH and 3784 shares in TLS), the outcome is significantly improved: 66% of trades excluded in COH for 83% of value captured, and 76% of trades excluded in TLS for 77% of value captured.
FIGURE 5

IN SUMMATION
Exchange dark pools are a very important source of liquidity in Australia, and there are some common pitfalls. To avoid banging your head on the shallow end, remember the following:
Participation in public dark pools is very high in Australia due to integrated order types and low broker dark pool share
Dark orders without an MEQ set can have a very outsized impact
Make sure you have a reasonable default MEQ ratio set – if your broker doesn’t support this, reconsider whether you should be trading with them
Happy swimming, and make sure to obey the lifeguard!
Mentions: Thank you to Rob Nash at ASX and Murrough O’Brien at Chi-X for help with the data, and a big thank you to Dima Lobanov at Credit Suisse who did all the actual work for this piece.


